
Note: This article covers the classic Inventory page. It is being phased out, and the sidebar marks it Retiring. We recommend Inventory V2 — the redesigned experience where new capabilities land first.
The Inventory page is where you see how much feed you have on hand, based on your most recent drone flight. This article walks through the main controls and what each part of the page shows.
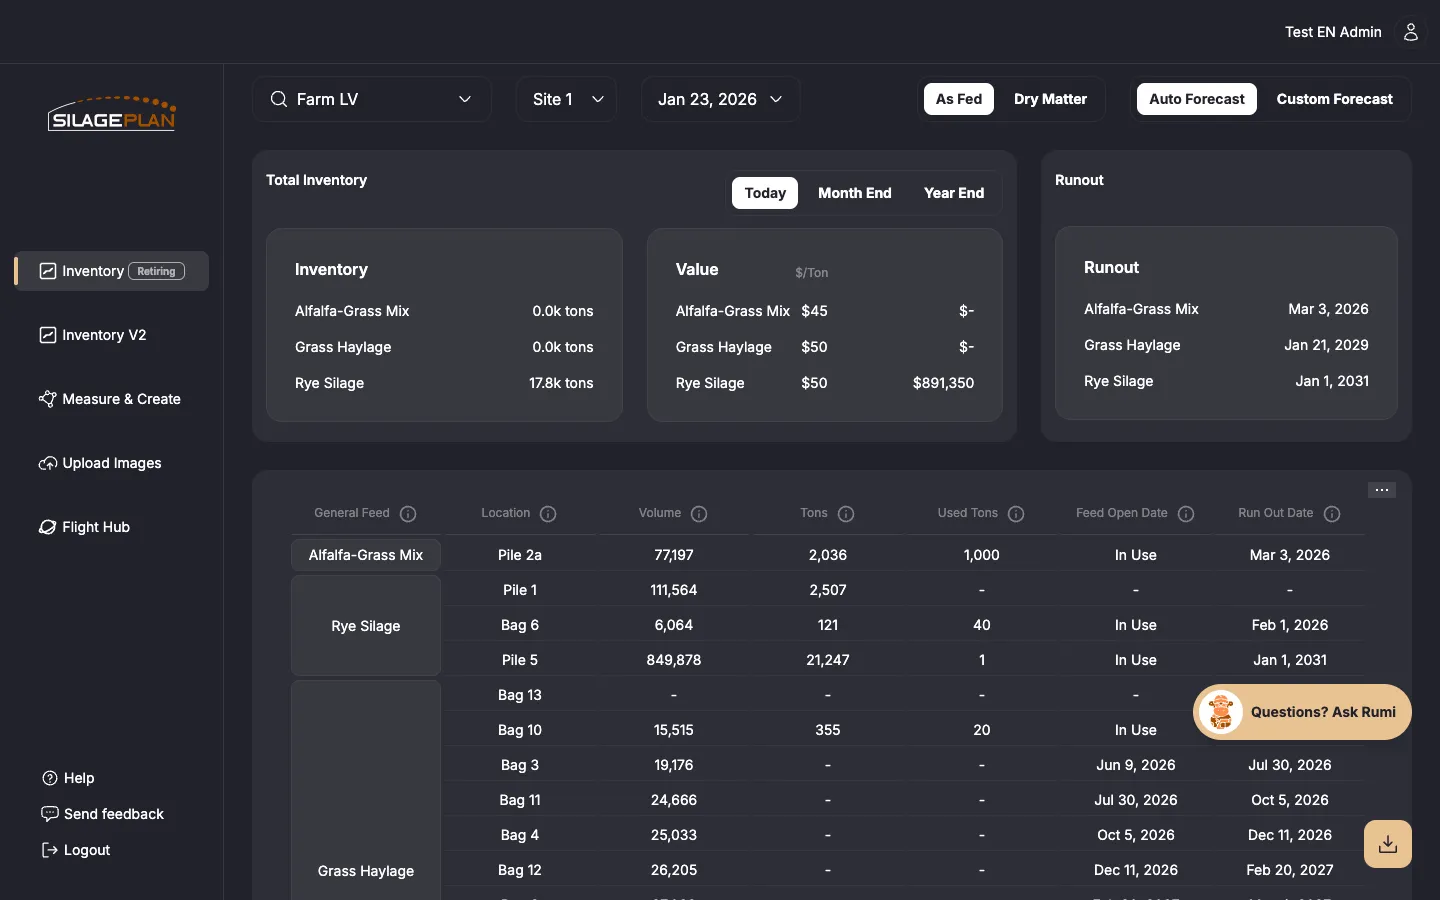
Choosing what to view
At the top of the page you pick which measurement you want to look at:
- Use the Farms search dropdown to select a farm. Start typing to filter the list.
- If the farm has more than one site, choose one from the Sites dropdown.
- Use Date Flown to pick which flight you want to view. Each flight is a snapshot of your inventory on that date.
Selecting an older date shows the inventory as it was measured on that flight, which is useful for comparing changes over time.
As Fed vs. Dry Matter
The As Fed / Dry Matter toggle controls how tonnage is displayed:
- As Fed shows tons at the moisture level the feed is actually in — what you would weigh on a scale.
- Dry Matter shows tons with the water removed, using each feed’s DM%. Nutritionists usually work in dry matter because rations are balanced on it.
Both views come from the same measurements; only the basis changes. (On Inventory V2, the toggle also tells you when a basis is unavailable because density values are missing.) See Working with silage density for how these numbers are calculated.
Auto Forecast vs. Custom Forecast
The Auto Forecast / Custom Forecast toggle controls which projection is used for runout dates and forecast values shown on the page. Auto Forecast is generated from your measured inventory and usage; Custom Forecast shows your own edited version if you have created one. Details are covered in Create a forecast.
Total inventory and the feed table
The Total Inventory section summarizes tonnage across your feed types, with values for Today, Month End, and Year End, and can be viewed by General Feed or Specific Feed category.
Below that, the feed table lists each location (bunk, pile, bag, or pit) with columns such as General Feed, Location, Volume, Tons, Density, DM %, Used Tons, Feed Open Date, and Run Out Date (some columns can be shown or hidden). A Per-day use chart appears below the table. Click a row to open it for editing — see Editing inventory records.
Units
Tonnage and volume respect your account units. In Settings, the Unit Type option switches between Imperial (cubic feet, short tons of 2,000 lbs) and Metric (cubic meters, metric tons of 1,000 kg).
Next steps
- Editing inventory records
- Tracking shrink between flights
- Inventory V2
- Prefer video? Watch the inventory walkthrough.